
Mineral Mapping on Hyperspectral Imageries Using Cohesion-based Self Merging Algorithm
Recently, hybrid clustering algorithms gained much research attention due to better clustering resultsand are computationally efficient.Hyperspectral image classification studies should be no exception, including mineral mapping. This studyaims to tackle the biggest challenge of mapping the mineralogy of drill core samples, which consumes a lot of time.In this paper, we present the investigation using a hybrid clustering algorithm, cohesion-based self-merging (CSM), for mineral mapping to determine the number and location of minerals that formed the rock. The CSM clustering performance was then compared to its classical counterpart, K-means plus-plus (K-means++). We conducted experimentsusinghyperspectral imagesfrom multiple rock samples to understand how well the clustering algorithm segmentedminerals that exist inthe rock. The samples in this study contain minerals with identical absorption features in certain locations that increase the complexity. The elbow method and silhouette analysis did not perform well in deciding the optimum cluster sizedue to slight variance and high dimensionality of the datasets. Thus, iterations to the various numbersof 푘-clustersand 푚-subclustersof each rock wereperformed toget the mineral cluster. Both algorithms were able to distinguish slight variations of absorption features of any mineral.
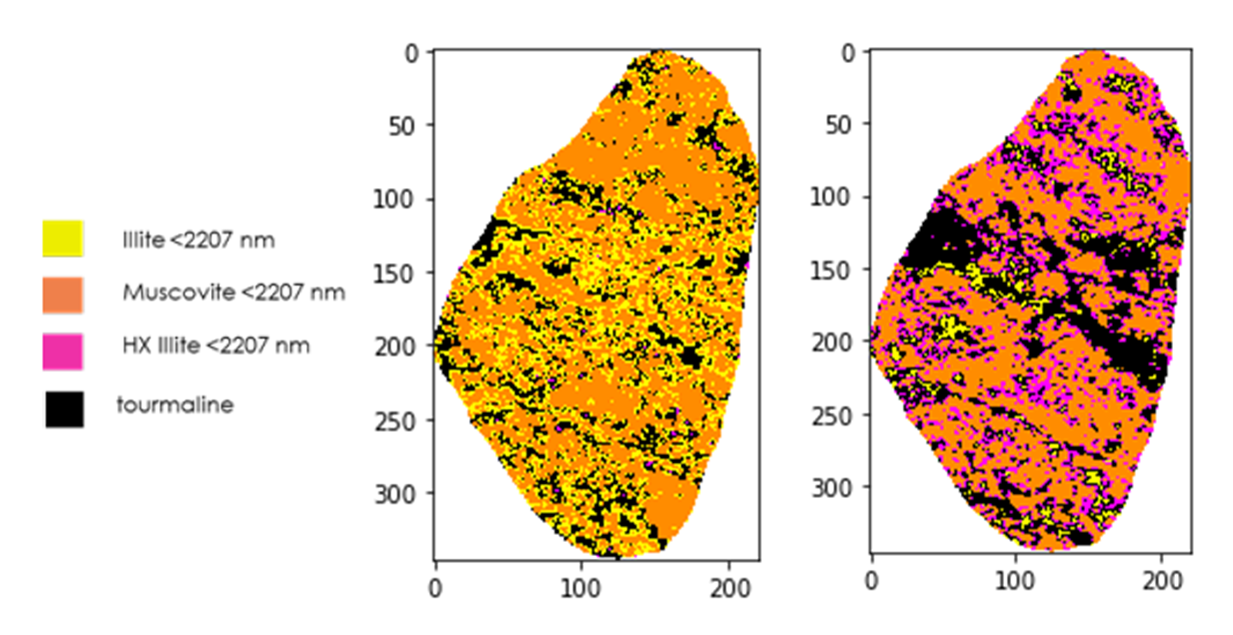 The spectral variation within a single mineral found by our algorithm might be studied further to understand any possible unidentified group of clusters. The spatial consideration of the CSM algorithm induced several misclassified pixels. Hence, the mineral maps produced in this study are not expected to be precisely similar to ground truths. Read more…
Ground-Penetrating Radar and Electrical Resistivity Tomography for Nickel Laterite Exploration: A Case Study in North Konawe, Indonesia
With the increasing demand of batteries for electrical vehicle in world, the interest of nickel laterite exploration and then its exploitation grow significantly. Nickel ore is one of the raw materials for making these batteries, which has high economic values, and is widely found in Indonesia. Therefore, extensive nickel exploration in Indonesia is highly required to obtain the estimation of its potential resources. Until now, data from boreholes near each other are used to calculate Nickel ore resources. To estimate the bedrock depth and horizontal variation between borehole data and therefore reducing operational costs, Ground-Penetrating Radar (GPR) and Electrical Resistivity Tomography (ERT) are the suitable methods for that purpose due to its cost and time effectiveness. In this research, we analyses several GPR profiles acquired with MALA Rough Terrain Antenna (RTA) 25 MHz antennas supported with ERT data in Antam exploration site in North Konawe, Southeast Sulawesi. Radar attributes are assigned after applying conventional processing steps.
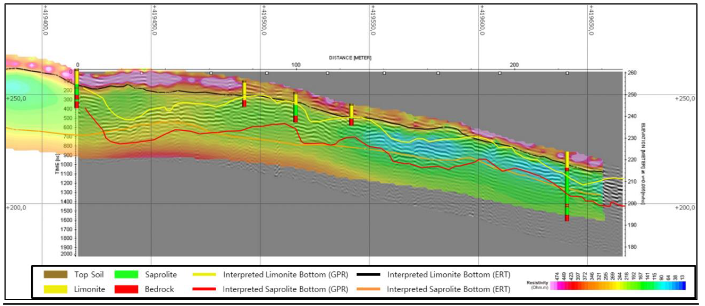 From preliminary results and its comparison with ERT and borehole data as validation tool, we obtained interesting results about the boundaries of limonite, saprolite, and bedrocks. Read more…
Geothermal Surface Manifestation Identification Using Airborne Hyperspectral Imagery Case Study: Davis-Schrimpf Geothermal Field, Salton Sea, California
Research on surface geothermal evidence has been done extensively using remote sensing techniques. For detailed remote sensing exploration on geothermal areas, UAV and airborne based were preferred over the satellite-based sensor. In this research, anomalies in surface temperature, mineral occurrence, and ammonia emission were studied on a set of airborne hyperspectral imagery from NASA, the Hyperspectral Thermal Emission Spectrometer (HyTES). High-resolution surface temperature and mineral maps were able to identify and describe the mineralogy of the mud pots and gryphons at the Davis-Schrimpf Geothermal Field, Salton Sea, California. From the surface temperature map, the surface temperature of the geothermal features wa s measured at approximately 314°K (40 o C) and higher. The purest pixels from MNF transformation of the first four cleanest bands of emissivity map produce endmembers that include the geothermal indicator minerals (barite, anhydrite, quartz, gypsum). Based on the mineralogy deposits, these manifestations are classified as potassic alteration types from a porphyry system that could be an indication of an active geothermal system. This also explains that the surface features are part of the upper reservoir of the Salton Sea Geothermal Field. On the other hand, ammonia detection that was performed in this research failed to get any clear recognition from the simple image processing.
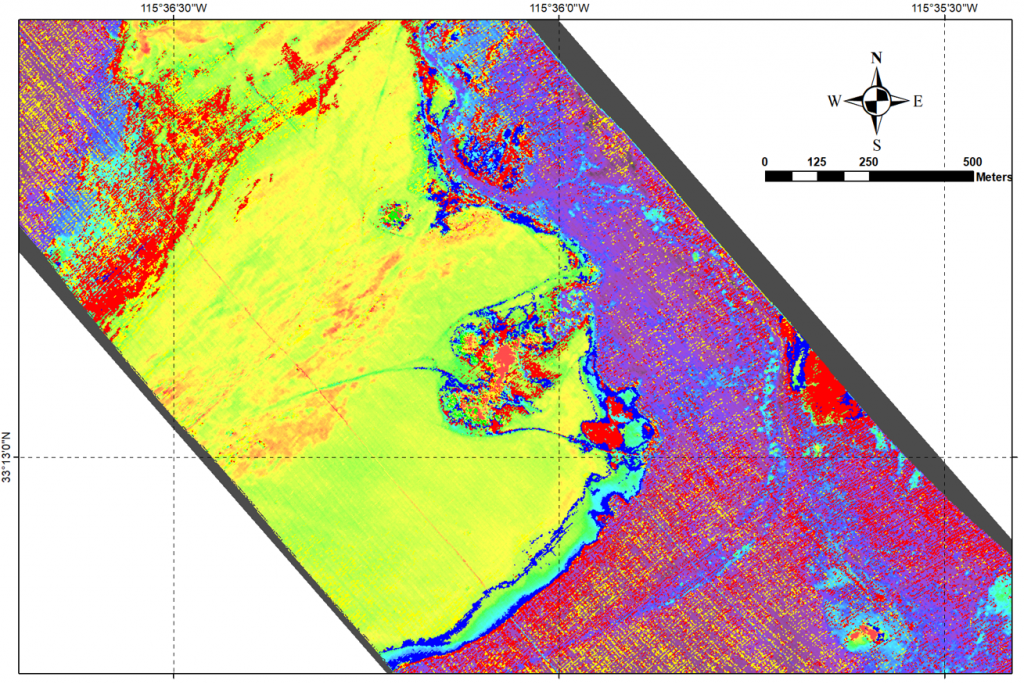
It is concluded that the airborne hyperspectral imagery could be a reliable option for remote sensing geothermal exploration, as it was able to characterize the surface geothermal manifestation with quite good detail using this imagery from a wide area of survey. Read more…
Ground Penetrating Radar for Nickel Laterite Exploration: A Case Study in Pakal Island, Indonesia
With the increasing demand of batteries for electrical vehicle in world, the interest of nickel laterite exploration and then its exploitation grow significantly. Nickel ore is one of the raw materials for making these batteries, which has high economic values, and is widely found in Indonesia. Therefore, extensive nickel exploration in Indonesia is urgently required to obtain the estimation of its potential resources. Until now, data from boreholes in close proximity to each other are used to calculate Nickel ore resources. To reduce the number of used boreholes and therefore reducing operational costs, Ground-Penetrating Radar (GPR) is suitable method for that purpose due to its cost-and time effectiveness. In this research we analysis two GPR profiles acquired with GSSI SIR-3000 system with unshielded 40 MHz antennas from GPR campaign in Pakal Island. After applying conventional processing steps such as time zero correction, dewow, bandpass filtering f-k filtering, and background removal, radar attributes are assigned.
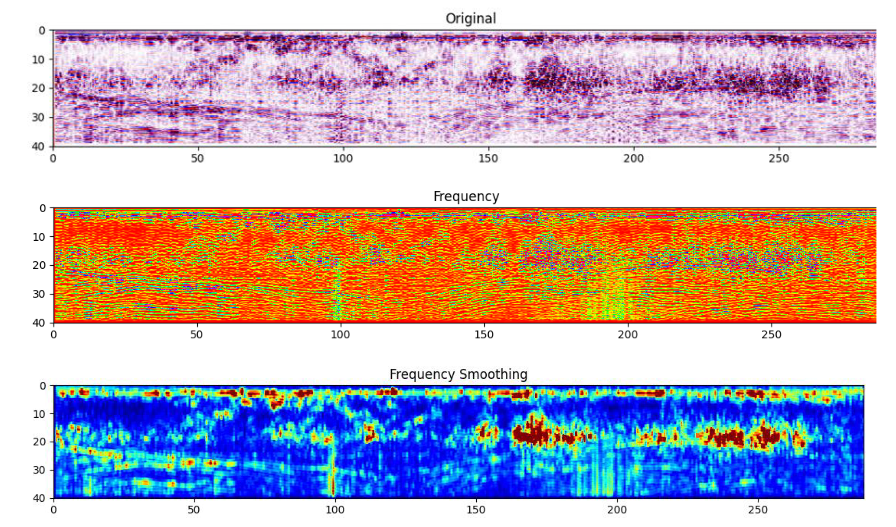
From preliminary results using instantaneous frequency and its comparison with borehole data as validation tool, we obtained interesting results about the boundaries of limonite, saprolite, and bedrocks. The next step will be frequency content clustering in each layer boundary with the aim of clarifying layer boundaries. Read more…
The Application of Parametric and Nonparametric Regression to Predict The Missing Well Log Data
Incomplete well log data are very commonly encountered problems in petroleum exploration activity. The development of artificial intelligence technology offers a new possible way to predict the required logs using limited information available. Optimizing conventional statistical theory, machine learning is proven to be a reliable tool for any prediction task in many fields of study. Regression is one of the basic methods that has rapid development and evolved many techniques with different approaches and purposes. In this study, parametric and nonparametric regressions {linear regression, Support Vector Machine (SVM), and Gaussian Process Regression (GPR)} are compared to predict the missing log using the available nearby data.

Feature selection was done by performing Principal Component Analysis (PCA) on predictor variables. Different profile of PCA is observed between Cibulakan and Parigi Formations, which is the basis of conducting separate models based on the formation. Among all the selected methods, GPR is consistently making slightly better results. The correlation between the predicted and actual porosity of GPR is observed to be up to 0.19 higher compared to the other methods. Similar observation is also found on the Root Mean Squared Error (RMSE) value comparison. In practice, the GPR method has an inherent advantage compared to other methods, as it provides uncertainty to the prediction based on the standard deviation of each estimation result. The standard deviation of the GPR prediction ranges from 0.006 in high confidence cases and up to 0.077 where uncertainty is high. The models are considered robust and stable according to the RMSE evaluation from cross validation which is consistently giving the value below 0.04. In conclusion, the reliability of regression techniques for predicting the missing well log is exposed in this study, which results demonstrate steady and good accuracy in every formation which are tested on any well logs. Read more…
Dip-steered Seismic Attributes and Petrophysics Analysis for Volcanic Reservoir Characterisation: A Case Study of Kora Volcano, New Zealand
Kora Volcano is a submarine stratovolcano that is located in Northern Taranaki Basin, New Zealand. Volcanism associated with the formation of Kora Volcano is suggested as the main factors that control the hydrocarbon prospect in this area. This study aimed on characterising volcanic reservoirs that structurally and stratigraphically complex. 3D seismic cube and well data were used to characterise the reservoir by performing seismic attributes and petrophysics analysis.
 Seismic attributes were generated from seismic data and accounted the local dipping and azimuth of the reflectors, known as dip-steering. Significant enhancement after the application of dip-steering in generating seismic attributes to delineate the complex structural framework suggested that the method is extremely important in modern seismic attributes analysis. Also, seismic interpretation accuracy was improved significantly by using dip-steered attributes as the guidance to define the complex structures. Last, combined with petrophysics analysis, these advanced seismic attributes were used to regulate the reservoir properties distribution in seismic data.
Geologically plausible model was produced that accounted not only petrophysics parameters, but also the influence of the structures that could be an alternative way for reservoir characterisation in highly sparse well data. Read more…
Application of First-Arrival Travel Time Tomography: Velocity Modeling for Time-to-Depth Conversion
 Seismic data has a broad range of lateral area recorded in time domain. Generally the seismic interpretation is done in time domain. Doing stratigraphic interpretation in time domain is usually sufficient. On the other hand, doing structure interpretation in time domain has a higher risk of pitfall. Time-to-depth conversion is one way to eliminate structure ambiguity in time domain and verify the structure. In this study, authors used the first-arrival travel time tomography method in modeling velocity for time-to-depth conversion. This method used the first-arrival travel time of seismic data. The travel time data, combined with the initial velocity model, became the input for travel time tomography. Tomographic process consisted of two processes: modeling and inversion of travel time. Modeling the travel time itself included travel time calculation and raytracing. The travel time inversion produced velocity model. The velocity model was then used in time-to-depth conversion. Then the result of the conversion was validated with VSP data. Validation of the velocity model showed good results. Hence, this method can be used in building velocity model which does not have data of time versus depth, such as checkshot or VSP data, for time-to-depth conversion. Read more…
Geoscience and earthquake insurance relation: a methodology to calculate premium based on density map of earthquake occurrence in West Java.

Earthquake insurance is an insurance that covers the risks that occur when buildings are damaged/destroyed due to an earthquake. In order to determine adequate premium for earthquake insurance, a grouping method based on building locations is needed. In Indonesia, the method for grouping the building locations is based on zones where several locations have not been classified to the district/municipality level. In other words, the zone grouping system still has a limited resolution. In addition to detailing the grouping, this paper also aims to make the level of earthquake vulnerability in West Java. The approach used is to make a density map based on earthquake intensity scale (MMI) and magnitude historical data. From these density map, the value of building exposure damage are calculated using the Mean Damage Ratio (MDR) parameter. This value is used as a pricing parameter for determining earthquake insurance premiums in more detail for each location. The results of this study indicate that the levels of damage to buildings are varied and earthquake insurance premiums have a high degree of non-uniformity in each municipality/district in this province.
Keywords: earthquake, density map, insurance premium
Read more…
Curie Point Depth Mapping Underneath Botswana for Geothermal Prospect Identification Using Aeromagnetic Data.
 The East African Rift System (EARS) is widely recognized as a major tectonic system that has excellent geothermal resources. A recent study in southern Africa found that there might still be rifting in the Passarge Basin in central Botswana, suggesting that the East African Rift System (EARS) is extended. This research was done to examine the implication of the extension of the EARS to the geothermal prospect that could be used as the preliminary information for further exploration in Botswana.
In this research, the Curie point depth (CPD) and heat flow map of Botswana were produced from aeromagnetic data. The method used was the spectral analysis (1DPSD) which considered as the ideal approach for a regional CPD study. This method has several parameters dependency, the pycurious algorithm was applied to overcome this issue. A window size 400 km with increments of 50 km was used in the algorithm to produce the CPD deeper than 40 km (based on the crustal thickness estimated in this region). The CPD and heat flow maps were compared to the existing geophysics and geological information to examine the implication of the extension of EARS to the geothermal prospect of Botswana. The prospective zones were delineated according to the heat flow value and the geological condition.
 The result indicates that the CPD appears to be consistent with the previously published crustal thickness model for the northern part of Botswana. The shallower CPD zones (<15km) are coincident with the thinner crust zones from the model (<40 km). These zones were distributed along the geologically weak area, from the northern part which is represented by the Ghanzi-Chobe Belt to the south-western part represented by the Nosop Basin. The heat flow map created was able to distinguish the high heat flow (>65 mW/m2) area that was comparable to the heat flow value in the well-developed geothermal field in the western branch of EARS. Two prospective geothermal zones were identified based on the anomalous heat flow, divided by the possible tectonic condition that caused the anomaly. The first zone was interpreted as the result of the continuation of the EARS, the other zone was interpreted as the result of the older tectonic activity in Early Proterozoic era or the current tectonic activity as indicated by the recent earthquake in this area.
Keywords: Curie Point, Heat Flow, Aeromagnetic, Botswana, East African Rift System, Crustal Thinning, Geothermal.
The Preliminary Results: Seismic Ambient Noise Rayleigh Wave Tomography Around Merapi Volcano, Central Java, Indonesia
 Ambient noise tomography is relatively a new method for imaging the shallow structure of the Earth subsurface. We presents the application of this method to produce a Rayleigh wave group velocity maps around the Merapi Volcano, Central Java. Rayleigh waves group velocity maps were reconstructed from the cross-correlation of ambient noise recorded by the DOMERAPI array which consists 43 broadband seismometers. In the processing stage, we first filtered the observation data to separatethe noise from the signal that dominated by the strong volcanic activities. Next, we cross-correlate the filtered data and stack to obtain the Green’s function for all possible station pairs. Then we carefully picked the peak of each Green’s function to estimate the dispersion trend and appliedMultiple Filter Technique to obtain the dispersion curve. Inter-station group velocity curvesare inverted to produceRayleigh wave group velocity maps for periods 1 to 10 s. The resulted Rayleigh group velocity maps show the interesting features around the Merapi Volcano which generally agree with the previous studies. Merapi-Lawu Anomaly (MLA) is emerged as a relatively low anomaly in our group velocity maps. Read more…